-
About
-
History
Milaha has a rich history, starting as a shipping agent in 1957 and becoming the first publicly registered shareholding company in Qatar, holding Commercial Registration No. (1). This legacy, supported by a diverse fleet of vessels, state-of-the-art equipment, dedicated staff, and world-class partners, has enabled the company to establish a strong regional presence in transportation and logistics.
Updates
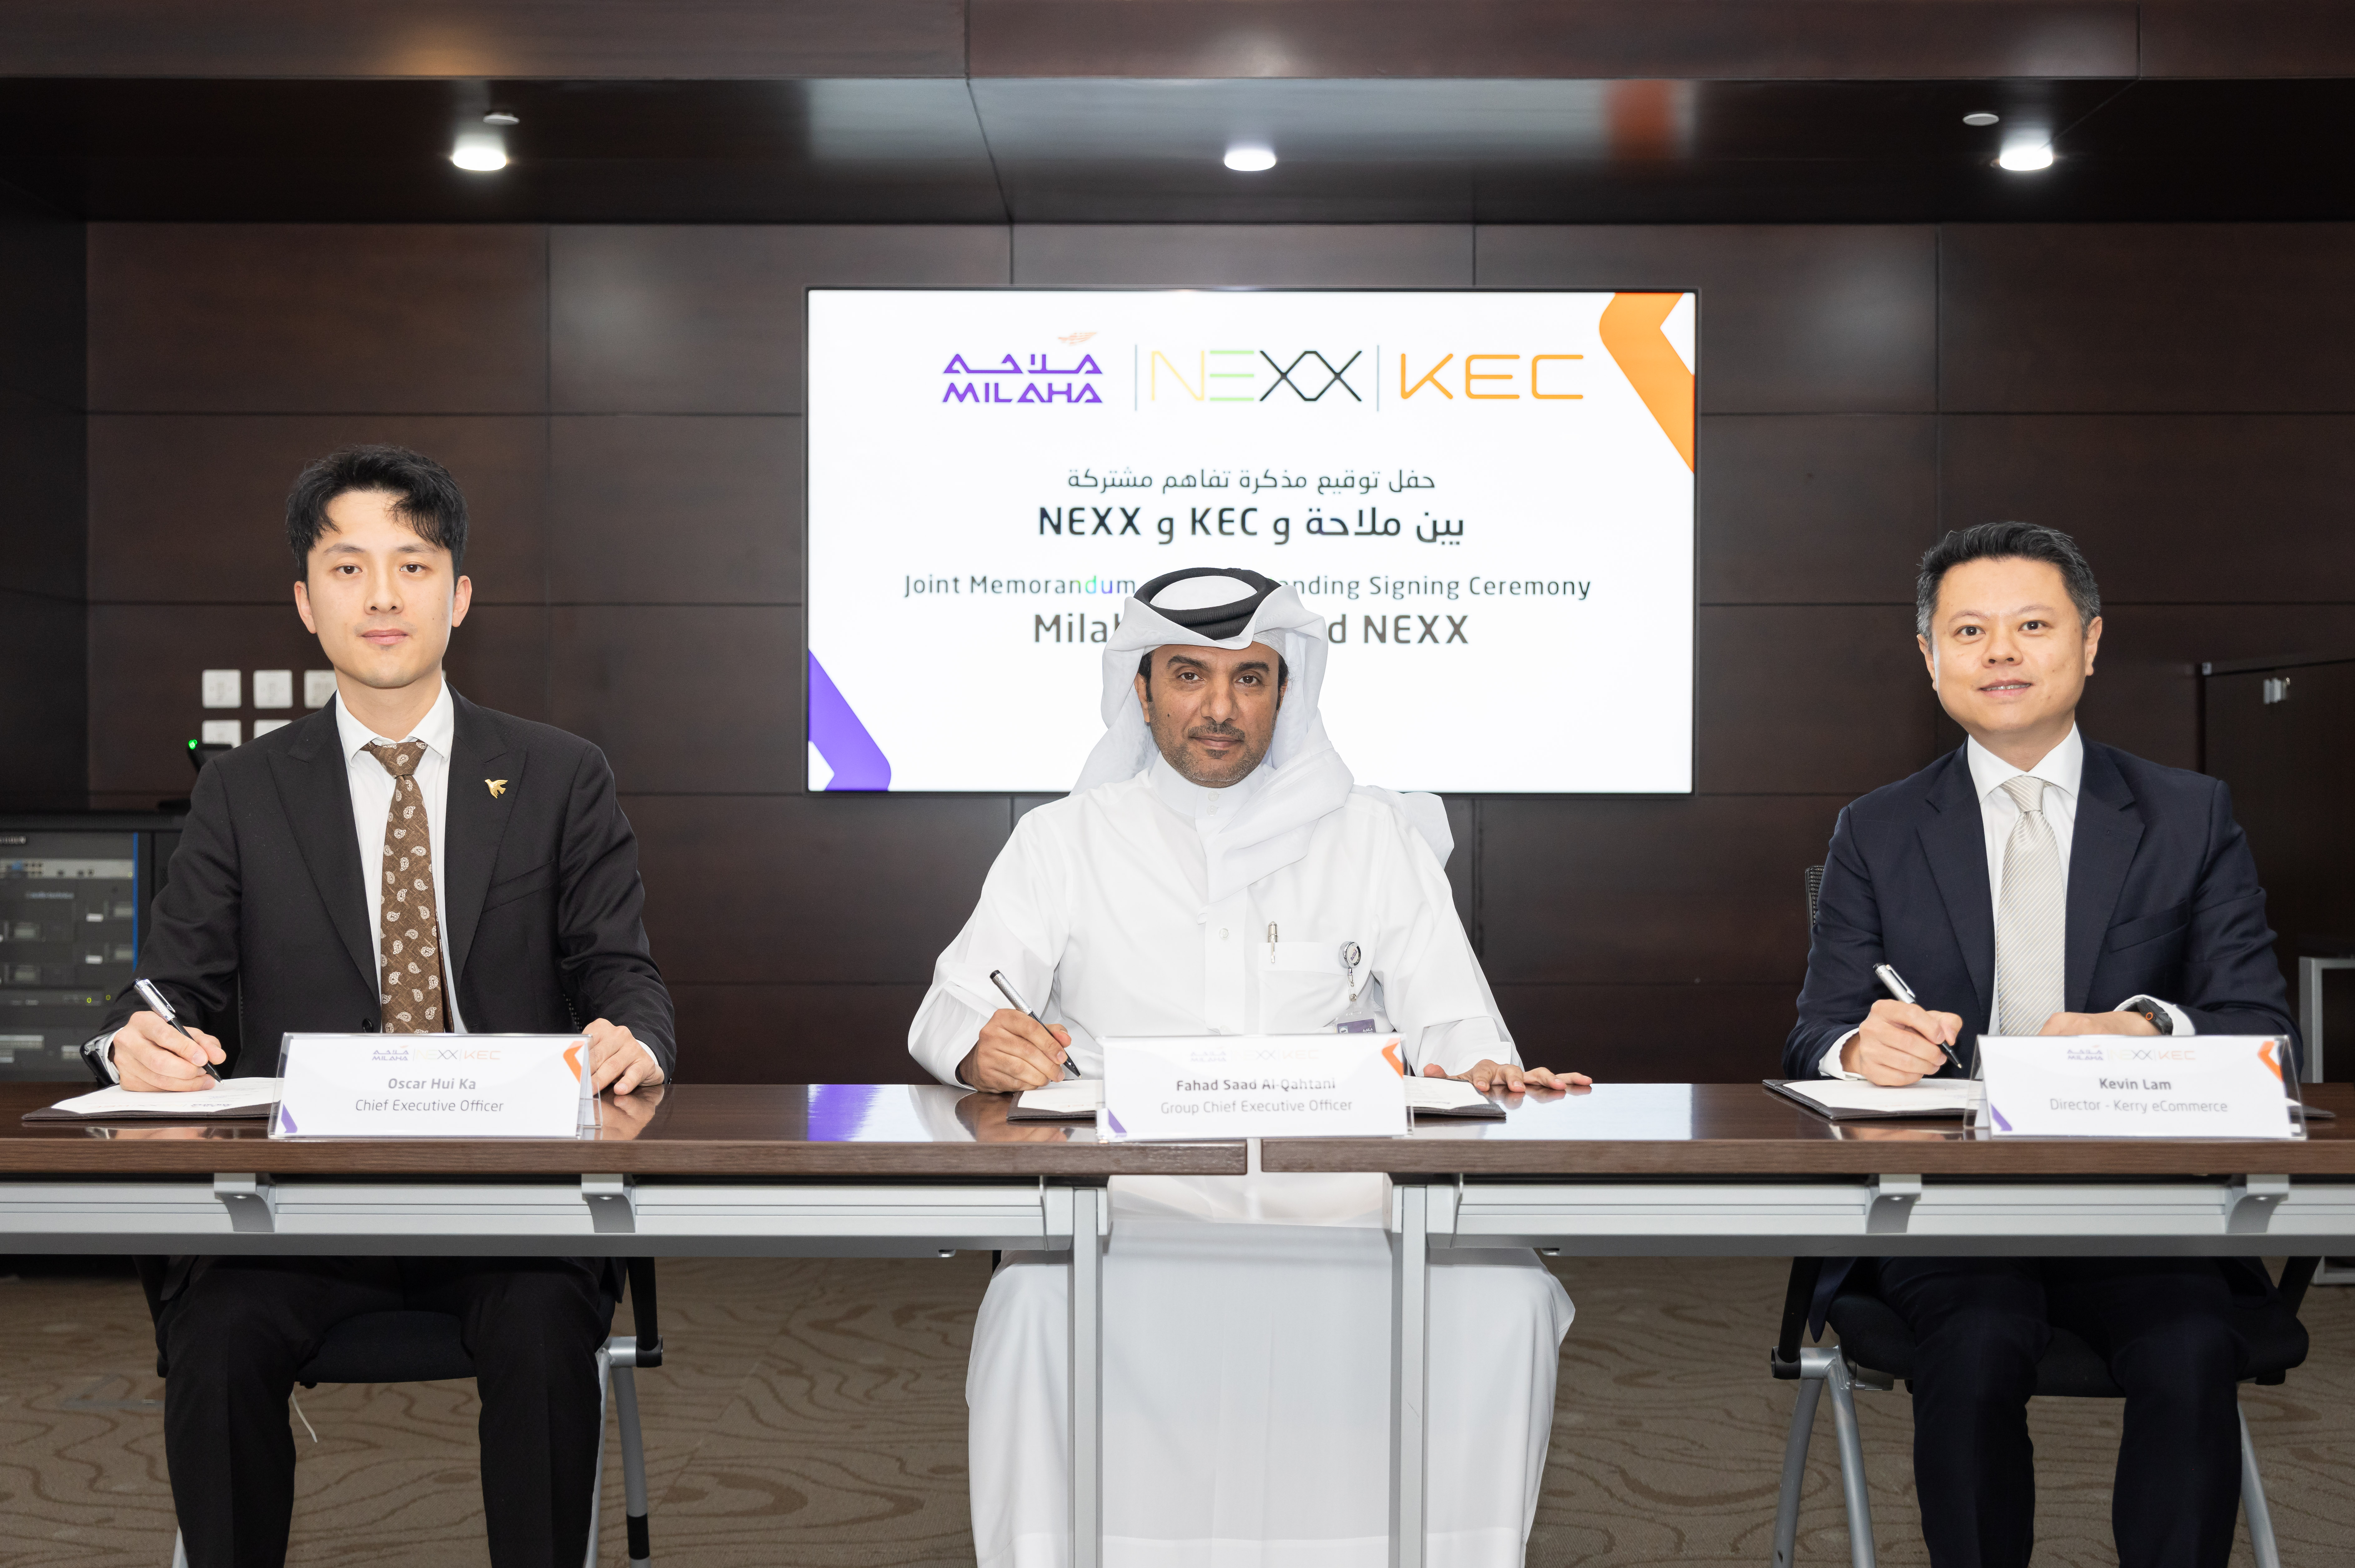
Milaha signs joint Memorandums of Understanding (MoU) with NEXX and KEC to Advance AI-Driven Logistics Solutions in Qatar and Capture E-commerce Growth 1 June 2025-
Quick links
-
Document Downloads
-
-
Board of Directors
Milaha’s Board of Directors brings together a group of accomplished individuals who are passionate about driving progress and creating lasting value. Their diverse expertise spans key sectors, and they play an essential role in shaping the company’s vision and direction. With a deep understanding of both local and regional dynamics, the Board supports Milaha’s journey towards sustainable growth, innovation, and excellence.

Updates
Milaha signs joint Memorandums of Understanding (MoU) with NEXX and KEC to Advance AI-Driven Logistics Solutions in Qatar and Capture E-commerce Growth 1 June 2025-
Quick links
-
Document Downloads
-
-
Executive Management
Milaha’s Executive Management team comprises seasoned leaders dedicated to translating the company’s vision into action and delivering operational excellence. With deep industry knowledge and a passion for innovation, they drive Milaha’s growth, resilience, and commitment to creating long-term value.

Updates
Milaha signs joint Memorandums of Understanding (MoU) with NEXX and KEC to Advance AI-Driven Logistics Solutions in Qatar and Capture E-commerce Growth 1 June 2025-
Quick links
-
Document Downloads
-
-
Core Values
At Milaha, we strive to serve our clients with excellence and continuously enhance the quality of our services. We are inspired by our legacy and driven to create lasting impact through innovation and collaboration. Our commitment to integrity and teamwork ensures we deliver on our promises and move forward together.

Updates
Milaha signs joint Memorandums of Understanding (MoU) with NEXX and KEC to Advance AI-Driven Logistics Solutions in Qatar and Capture E-commerce Growth 1 June 2025-
Quick links
-
Document Downloads
-
-
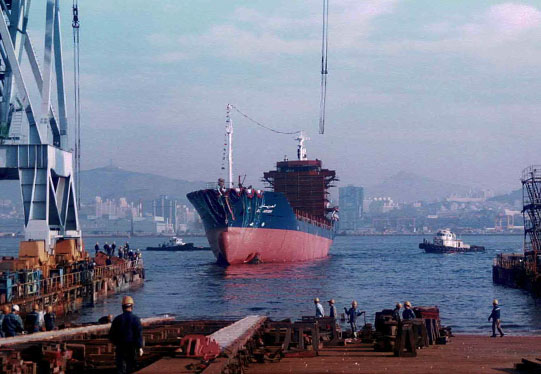
Fleet
Milaha’s fleet journey began in 1958 and has since grown to over 70+ vessels, including barges, chartered tugs, geared bulk and break bulk carriers. Today, Milaha operates one of the largest specialised container fleets in the Arabian Gulf.

Updates
Milaha signs joint Memorandums of Understanding (MoU) with NEXX and KEC to Advance AI-Driven Logistics Solutions in Qatar and Capture E-commerce Growth 1 June 2025-
Quick links
-
Document Downloads
-
-
History
-
Business Areas
-
Maritime & Logistics
Type
Updates
Milaha signs joint Memorandums of Understanding (MoU) with NEXX and KEC to Advance AI-Driven Logistics Solutions in Qatar and Capture E-commerce Growth 1 June 2025-
Quick links
-
Document Downloads
-
-
Marine & Technical Services
Updates
Milaha signs joint Memorandums of Understanding (MoU) with NEXX and KEC to Advance AI-Driven Logistics Solutions in Qatar and Capture E-commerce Growth 1 June 2025-
Quick links
-
Document Downloads
-
-
Offshore & Marine
Type
Updates
Milaha signs joint Memorandums of Understanding (MoU) with NEXX and KEC to Advance AI-Driven Logistics Solutions in Qatar and Capture E-commerce Growth 1 June 2025-
Quick links
-
Document Downloads
-
-
Gas & Petrochem
Type
Updates
Milaha signs joint Memorandums of Understanding (MoU) with NEXX and KEC to Advance AI-Driven Logistics Solutions in Qatar and Capture E-commerce Growth 1 June 2025-
Quick links
-
Document Downloads
-
-
Capital
Type
Updates
Milaha signs joint Memorandums of Understanding (MoU) with NEXX and KEC to Advance AI-Driven Logistics Solutions in Qatar and Capture E-commerce Growth 1 June 2025-
Quick links
-
Document Downloads
-
-
Maritime & Logistics
-
Investor Relations
-
Overview
Investor relations activities are intended to present shareholders with detailed information and data on Qatar navigation's performance and its achievements during the year, along with outlining major business plans and objectives.

Updates
Milaha signs joint Memorandums of Understanding (MoU) with NEXX and KEC to Advance AI-Driven Logistics Solutions in Qatar and Capture E-commerce Growth 1 June 2025-
Quick links
-
Document Downloads
-
-
Milaha Stock
Investor relations activities are intended to present shareholders with detailed information and data on Qatar navigation's performance and its achievements during the year, along with outlining major business plans and objectives.

Updates
Milaha signs joint Memorandums of Understanding (MoU) with NEXX and KEC to Advance AI-Driven Logistics Solutions in Qatar and Capture E-commerce Growth 1 June 2025-
Quick links
-
Document Downloads
-
-
Financial Information
Investor relations activities are intended to present shareholders with detailed information and data on Qatar navigation's performance and its achievements during the year, along with outlining major business plans and objectives.

Updates
Milaha signs joint Memorandums of Understanding (MoU) with NEXX and KEC to Advance AI-Driven Logistics Solutions in Qatar and Capture E-commerce Growth 1 June 2025-
Quick links
-
Document Downloads
-
-
Shareholder & AGAM
Investor relations activities are intended to present shareholders with detailed information and data on Qatar navigation's performance and its achievements during the year, along with outlining major business plans and objectives.

Updates
Milaha signs joint Memorandums of Understanding (MoU) with NEXX and KEC to Advance AI-Driven Logistics Solutions in Qatar and Capture E-commerce Growth 1 June 2025-
Quick links
-
Document Downloads
-
-
Corporate Governance
Investor relations activities are intended to present shareholders with detailed information and data on Qatar navigation's performance and its achievements during the year, along with outlining major business plans and objectives.

Updates
Milaha signs joint Memorandums of Understanding (MoU) with NEXX and KEC to Advance AI-Driven Logistics Solutions in Qatar and Capture E-commerce Growth 1 June 2025-
Quick links
-
Document Downloads
-
-
Useful Information
Investor relations activities are intended to present shareholders with detailed information and data on Qatar navigation's performance and its achievements during the year, along with outlining major business plans and objectives.

Updates
Milaha signs joint Memorandums of Understanding (MoU) with NEXX and KEC to Advance AI-Driven Logistics Solutions in Qatar and Capture E-commerce Growth 1 June 2025-
Quick links
-
Document Downloads
-
-
Overview
-
Media Center
-
News & Magazine
Our news blog contains notifications, service updates, industry news and information on what is happening at Milaha.

Updates
Milaha signs joint Memorandums of Understanding (MoU) with NEXX and KEC to Advance AI-Driven Logistics Solutions in Qatar and Capture E-commerce Growth 1 June 2025-
Quick links
-
Document Downloads
-
-
Blog

Updates
Milaha signs joint Memorandums of Understanding (MoU) with NEXX and KEC to Advance AI-Driven Logistics Solutions in Qatar and Capture E-commerce Growth 1 June 2025-
Quick links
-
Document Downloads
-
-
News & Magazine
Financial Information
Total Assets
Operating Revenues (QR mn)
Operating Expense (QR mn)
Historical Dividends per Share (QR)
EBITDA (QR mn)
Net Profit (QR mn)
Consolidated Annual Results
Balance Sheet Items
| Balance Sheet (QR Millions) | 2018 | 2019 | 2020 | 2021 | 2022 | 2023 | 2024 |
|---|---|---|---|---|---|---|---|
| Property, Vessels & Equipment | 4,031 | 4,063 | 3,250 | 3,005 | 2,841 | 2,776 | 3,095 |
| Investment Property | 1,299 | 823 | 799 | 782 | 884 | 856 | 875.68 |
| Intangible Assets | 160 | 149 | 152 | 91 | 16 | 13 | 4.416 |
| Right of Use Assets | - | 155 | 228 | 144 | 210 | 115 | 118.368 |
| Investments in Joint Arrangements | 950 | 1,090 | 964 | 994 | 1,025 | 1,022 | 1,084 |
| Investments in Associates | 5,365 | 5,914 | 6,002 | 6,605 | 7,548 | 7,819 | 8,249 |
| Financial Assets at FVOCI | 4,101 | 4,099 | 3,741 | 3,557 | 2,567 | 2,914 | 2,854 |
| Loans granted to LNG Companies | 150 | 129 | 124 | 125 | 102 | 90 | 77 |
| Other Assets | 26 | 24 | 24 | 24 | 0 | 365 | |
| Total Non-Current Assets | 16,082 | 16,447 | 15,284 | 15,327 | 15,193 | 15,605 | 16,723 |
| Inventories | 122 | 81 | 78 | 103 | 115 | 92 | 62 |
| Trade & Other Receivables | 760 | 741 | 764 | 879 | 1,036 | 971 | 1,073 |
| Equity Instruments at FVTPL | 139 | 56 | 117 | 505 | 502 | 501 | 646 |
| Loan to a Related Party | - | - | 393 | - | - | 0 | 0 |
| Investments in Term Deposits | 578 | 168 | 71 | 350 | 1,237 | 633 | 515 |
| Cash & Cash Equivalents | 127 | 178 | 306 | 305 | 230 | 414 | 188 |
| Total Current Assets | 1,726 | 1,224 | 1,728 | 2,142 | 3,120 | 2,612 | 2,484 |
| TOTAL ASSETS | 17,808 | 17,671 | 17,012 | 17,469 | 18,313 | 18,216 | 19,207 |
| Loans and Borrowings | 2,149 | 1,837 | 1,403 | 1,057 | 299 | 64 | 475 |
| Advance from a customer | 115 | 107 | 99 | 91 | 83 | 75 | 67 |
| Lease Liabilities | - | 109 | 154 | 63 | 139 | 47 | 62 |
| Provision for Employees' end of service benefits | 121 | 120 | 114 | 110 | 115 | 117 | 123 |
| Total Non-Current Liabilities | 2,385 | 2,173 | 1,770 | 1,320 | 637 | 303 | 727 |
| Trade and Other Payables | 511 | 576 | 675 | 810 | 755 | 692 | 764 |
| Loans and Borrowings | 274 | 270 | 718 | 485 | 757 | 418 | 175 |
| Lease Liabilities | - | 54 | 91 | 94 | 81 | 80 | 64 |
| Total Current Liabilities | 785 | 900 | 1,484 | 1,389 | 1,593 | 1,191 | 1,002 |
| TOTAL LIABILITIES | 3,170 | 3,073 | 3,254 | 2,710 | 2,229 | 1,494 | 1,729 |
| Share Capital | 1,145 | 1,145 | 1,145 | 1,145 | 1,136 | 1,136 | 1,136 |
| Treasury Shares | (74) | (74) | (74) | (74) | - | - | 0 |
| Legal Reserve | 4,694 | 4,694 | 4,694 | 4,694 | 4,694 | 4,694 | 4,694 |
| General Reserve | 624 | 624 | 624 | 624 | 624 | 624 | 624 |
| Fair Value Reserve | 3,886 | 3,876 | 3,368 | 3,408 | 2,472 | 2,465 | 2,350 |
| Hedging Reserve | 296 | 68 | (96) | 279 | 994 | 982 | 1240 |
| Retained Earnings | 4,011 | 4,210 | 4,043 | 4,644 | 6,122 | 6,781 | 7,448 |
| TOTAL EQUITY Attributable to Equity Holders of Parent | 14,582 | 14,543 | 13,703 | 14,720 | 16,042 | 16,681 | 17,475 |
Income Statement Items
| Income Statement (QR Millions) | 2018 | 2019 | 2020 | 2021 | 2022 | 2023 | 2024 |
|---|---|---|---|---|---|---|---|
| Operating Revenue | 2,420 | 2,425 | 2,267 | 2,784 | 3,285 | 2,942 | 2,840 |
| Salaries, Wages & Benefits | (563) | (589) | (581) | (603) | (632) | (650) | (694) |
| Operatiing Supplies & Expenses | (941) | (1,001) | (840) | (1,328) | (1,563) | (1,284) | (1,016) |
| Rent Expense | (15) | (7) | (5) | (7) | (8) | (11) | (8) |
| Depreciation & Amortization | (334) | (362) | (367) | (368) | (370) | (391) | (442) |
| Bad Debt Provisions | (7) | (7) | (26) | (10) | (45) | (8) | 15 |
| Other Operating Expenses | (159) | (177) | (169) | (214) | (181) | (162) | (159) |
| Operating Expenses | (2,019) | (2,142) | (1,989) | (2,531) | (2,798) | (2,505) | (2303) |
| Operating Profit | 401 | 283 | 279 | 253 | 487 | 436 | 536 |
| Finance Expense | (148) | (103) | (84) | (73) | (59) | (50) | (32) |
| Finance Income | 62 | 24 | 21 | 15 | 15 | 19 | 11 |
| Gain/Loss on Disposal of Assets | 1 | 16 | 87 | (5) | 21 | 10 | 8 |
| Joint Arrangements - Share of Results | 165 | 239 | 85 | 205 | 179 | 127 | 144 |
| Associates - Share of Results | 273 | 361 | 418 | 476 | 542 | 520 | 585 |
| FX Gain/Loss | 0 | (1) | (1) | 6 | (1) | (1) | (1) |
| Tax | - | (1) | (5) | (4) | (1) | (14) | (14) |
| Impairments - Vessels | (243) | (272) | (578) | (148) | (80) | (20) | (54) |
| Impairments - NonVessels | - | - | (163) | - | (86) | 0 | (63) |
| Non-Operating Income/(Expenses) | 111 | 263 | (220) | 474 | 530 | 593 | 583 |
| Net Income (Group) | 512 | 546 | 59 | 727 | 1,016 | 1,030 | 1,120 |
| Non-Controlling Interest | (5) | (1) | 0 | 2 | 4 | (1) | (2) |
| Net Income (Parent) | 516 | 547 | 59 | 724 | 1,013 | 1,030 | 1,122 |
| EBITDA | 1,175 | 1,259 | 1,236 | 1,303 | 1,597 | 1,485 | 1,713 |
Financial Ratios
| Financial Ratios | 2018 | 2019 | 2020 | 2021 | 2022 | 2023 | 2024 |
|---|---|---|---|---|---|---|---|
| Operating Profit Margin | 17% | 12% | 12% | 9% | 15% | 15% | 18.9% |
| Return on Assets (ROA) | 2.8% | 3.1% | 0.3% | 4.2% | 5.7% | 5.6% | 6.0% |
| Return on Equity (ROE) of Parent | 3.7% | 3.8% | 0.4% | 5.1% | 6.6% | 6.3% | 6.6% |
| Debt (LT Interest Bearing) to Equity Ratio | 14.7% | 12.6% | 10.2% | 7.2% | 1.9% | 0.4% | 2.72% |
Financial Documents
Financial Types
Financial Year
| Description | Downloads / View |
|---|---|
| Financial 2024 | |
| Financial 2023 | |
| Financial 2022 | |
| Financial 2021 | |
| Financial 2020 | |
| Financial 2019 | |
| Financial 2018 | |
| Financial 2017 | |
| Financial 2016 | |
| Financial 2015 | |
| Financial 2014 | |
| Financial 2013 | |
| Financial 2012 | |
| Financial 2011 | |
| Financial 2010 |
| Description | Downloads / View |
|---|---|
| Annual Report 2024 | |
| Annual Report 2023 | |
| Annual Report 2022 | |
| Annual Report 2021 | |
| Annual Report 2020 | |
| Annual Report 2019 | |
| Annual Report 2018 | |
| Annual Report 2017 | |
| Annual Report 2016 | |
| Annual Report 2015 | |
| Annual Report 2014 | |
| Annual Report 2013 | |
| Annual Report 2012 | |
| Annual Report 2011 | |
| Annual Report 2010 |
| Description | Q1 | Q2 | Q3 | Q4 |
|---|---|---|---|---|
| Quarterly Disclosure 2023 | ||||
| Quarterly Disclosure 2022 | ||||
| Quarterly Disclosure 2021 | ||||
| Quarterly Disclosure 2020 | ||||
| Quarterly Disclosure 2019 |